4519.0 - Recorded Crime - Offenders, 2014-15  Quality Declaration
Quality Declaration ARCHIVED ISSUE Released at 11:30 AM (CANBERRA TIME) 24/02/2016
Page tools:
 Print Page Print Page
 Print All Print All
| ||
|
PRINCIPAL OFFENCE Principal offence refers to the most serious offence type for which a person has been proceeded against during the reference period. This is determined through the ranking of offences in the National Offence Index (NOI). For details of the Index refer to Appendix 2. For a definition of principal offence, refer to Explanatory Notes paragraphs 13-15. Nationally, the most prevalent principal offences in 2014-15 were:
Approximately 70% of offenders had a principal offence in one of the above four categories. 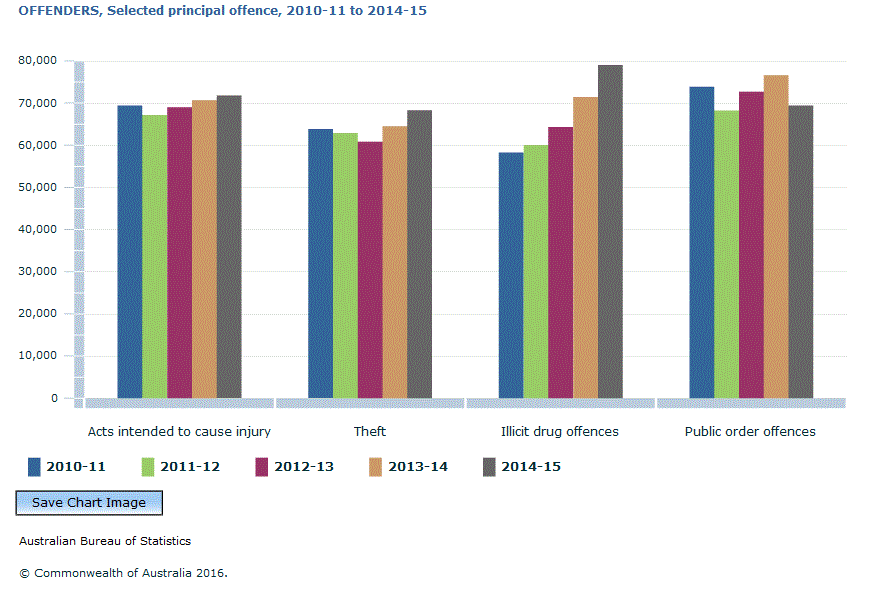 Source(s): Recorded Crime - Offenders Offender rates for most principal offence types were similar to 2013-14, although the offender rate per 100,000 persons aged 10 years and over for Illicit drug offences increased from 352 in 2013-14 to 384 in 2014-15. The principal offences with the largest proportional increases were Abduction/harassment (up 16%, or 610 offenders), Prohibited/regulated weapons offences (up 13%, or 1,364 offender) and Illicit drug offences (up 11%, or 7,591 offenders). (Table 1) This was the sixth consecutive cycle in which the number of illicit drug offenders has increased, and follows an 11% increase in 2013-14. Two thirds of these offenders were proceeded against for Possess and/or use illicit drugs, with a further 13% for Deal or traffic in illicit drugs. (Table 4) Every state and territory saw an increase in this offence type in 2014-15, with the largest proportional increase in Western Australia (up 1,303 offenders, or 23%). Prohibited/regulated weapons offences was the only other offence type to increase in every state and territory. (Tables 8-15) Sex The most common principal offences for males in 2014-15 were:
For females, the most common principal offences were:
 Source(s): Recorded Crime - Offenders Age The median age of offenders varied by principal offence. Nationally, the offences with the three oldest median ages in 2014-15 (excluding miscellaneous offences) were:
The offences with the youngest median ages were:
Since the introduction of national data in 2008-09, the median age has increased for every offence category with the exception of Sexual assault and Illicit drug offences, which have remained steady.  Source(s): Recorded Crime - Offenders State and territory Offender rates for particular offence types differed by state and territory. This was sometimes due to legislative and operational differences between states. For example, New South Wales had the highest offender rate for Theft in 2014-15, however this was largely due to public transport fare evasion, which is a police responsibility in NSW but not in most other jurisdictions. Caution should therefore be exercised when making comparisons between states and territories. For more detailed information relating to issues of data comparability, refer to paragraphs 56-82 of the Explanatory Notes. For the selected principal offences, as shown in the following graph, offender rates in 2014-15 were highest for:
Offender rates for all principal offence divisions are available in Table 6 of the data cubes, available on the Downloads tab. , Selected principal offence by states and territories, 2014-15.GIF) Footnote(s): (a) Rate per 100,000 population (see Explanatory Notes paragraphs 17-21). (b) South Australian data may be overstated (see Explanatory Notes paragraphs 67-68). (c) Australian Capital Territory data may be overstated (see Explanatory Notes paragraphs 81-82). Source(s): Recorded Crime - Offenders Document Selection These documents will be presented in a new window.
|
|
